Vancouver Housing Market 2023#
The Vancouver housing market in 2023 faced unprecedented challenges, with high borrowing costs casting a shadow over the real estate landscape. Despite a decline in home sales, the market exhibited surprising resilience, concluding the year with balanced conditions.
Home Sales#
Home sales data is obtained from the monthly MLS® Sales Facts published by both Real Rstate Board of Greater Vancouver (REBGV) and Fraser Valley Real Estate Board (FVREB).
Key Observations#
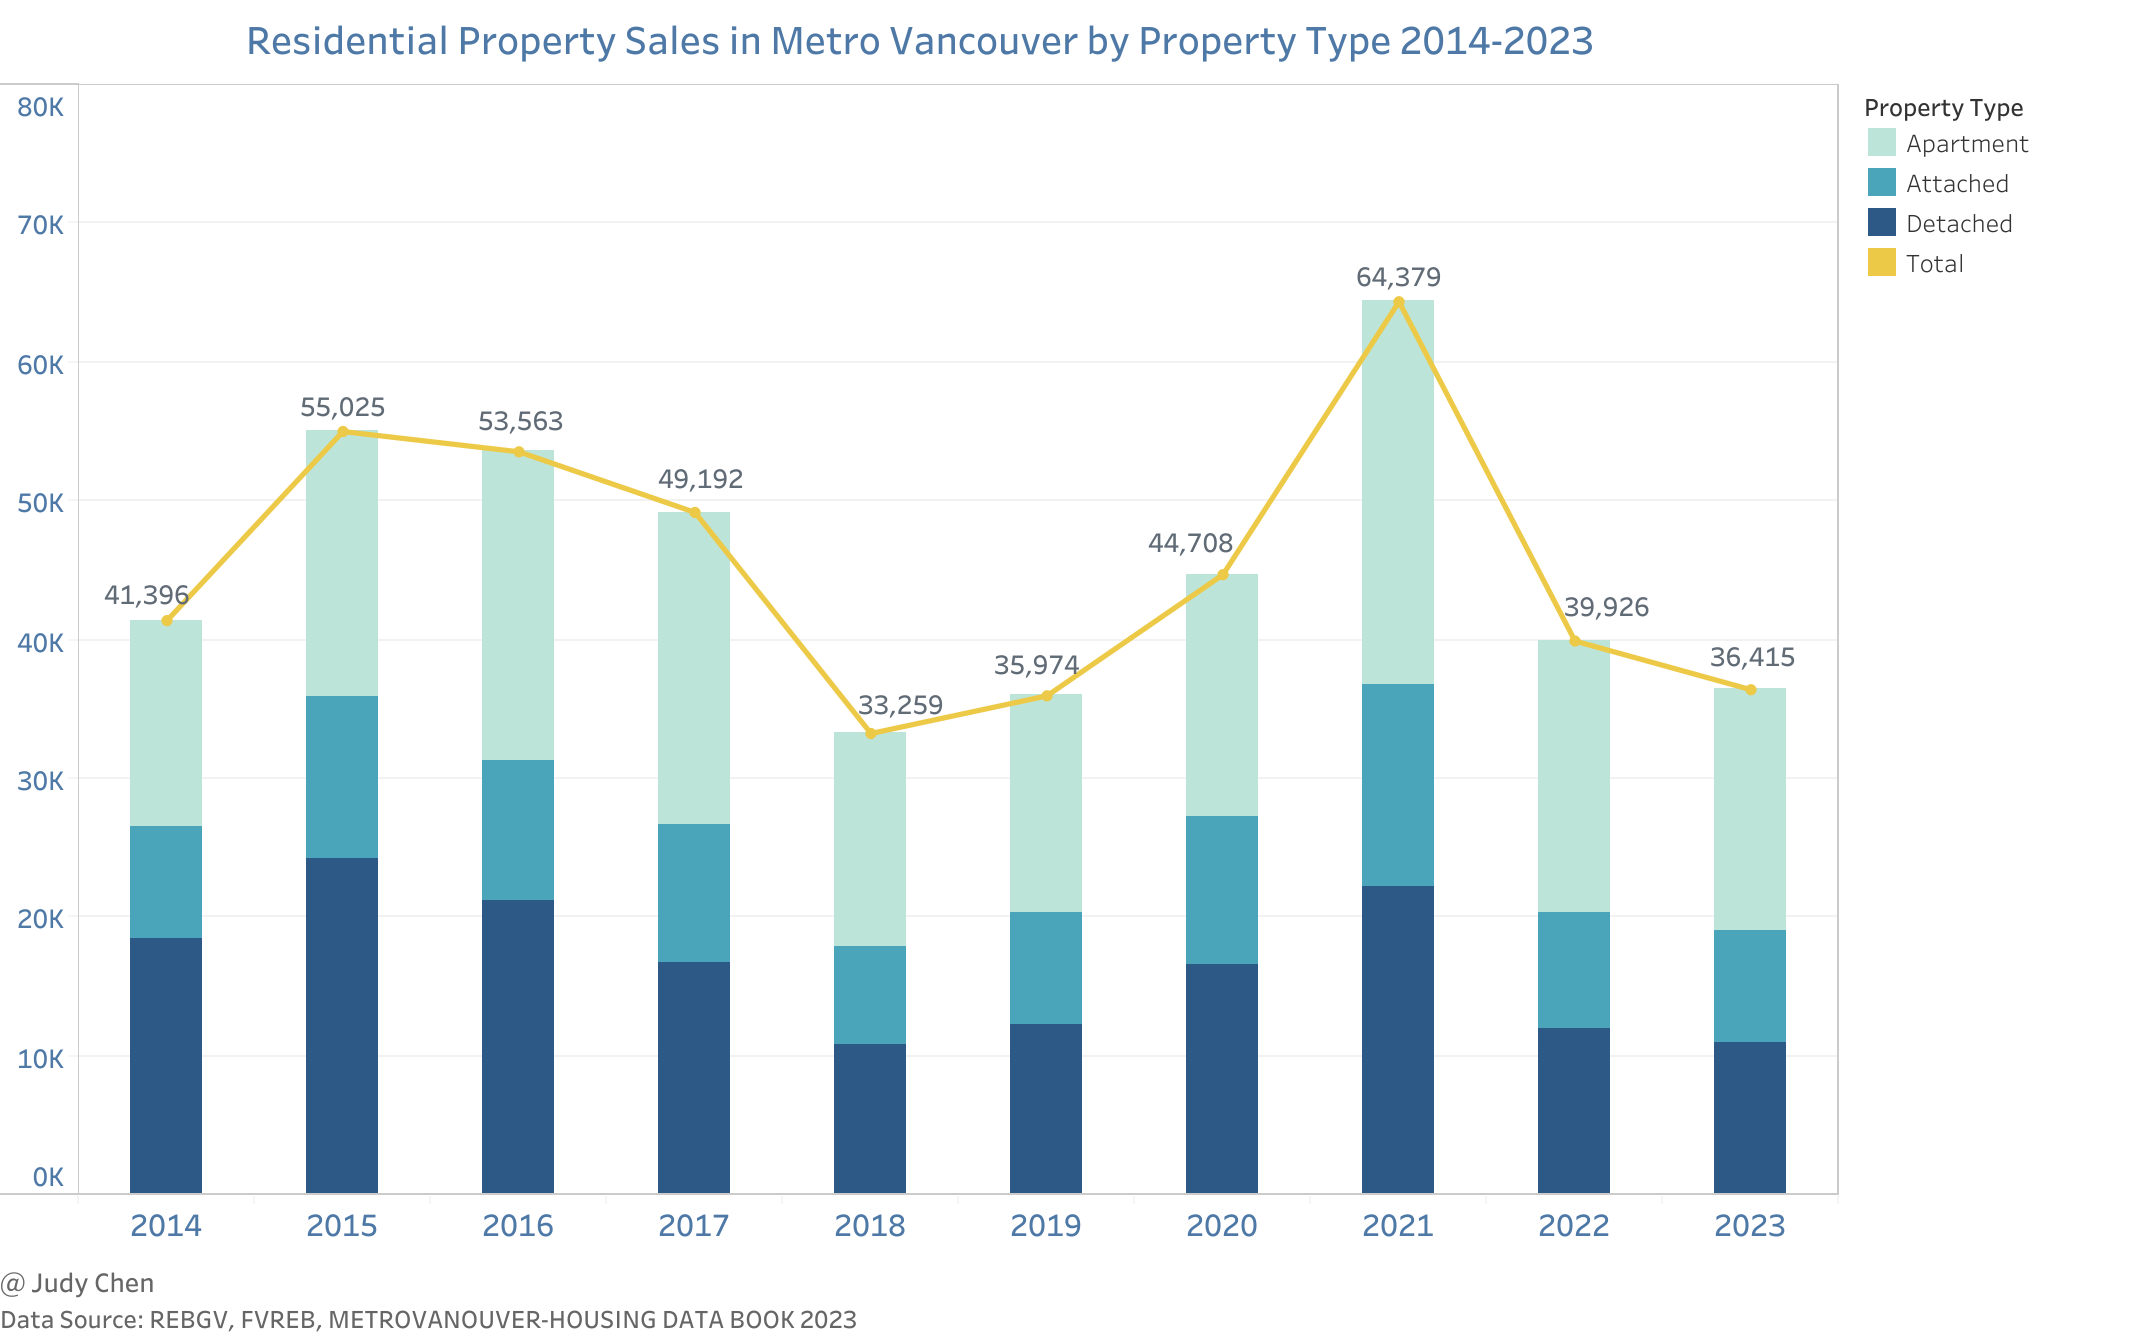
In 2023, Metro Vancouver witnessed an 8.8% decrease in home sales, following a sharp 40% decline in 2022.
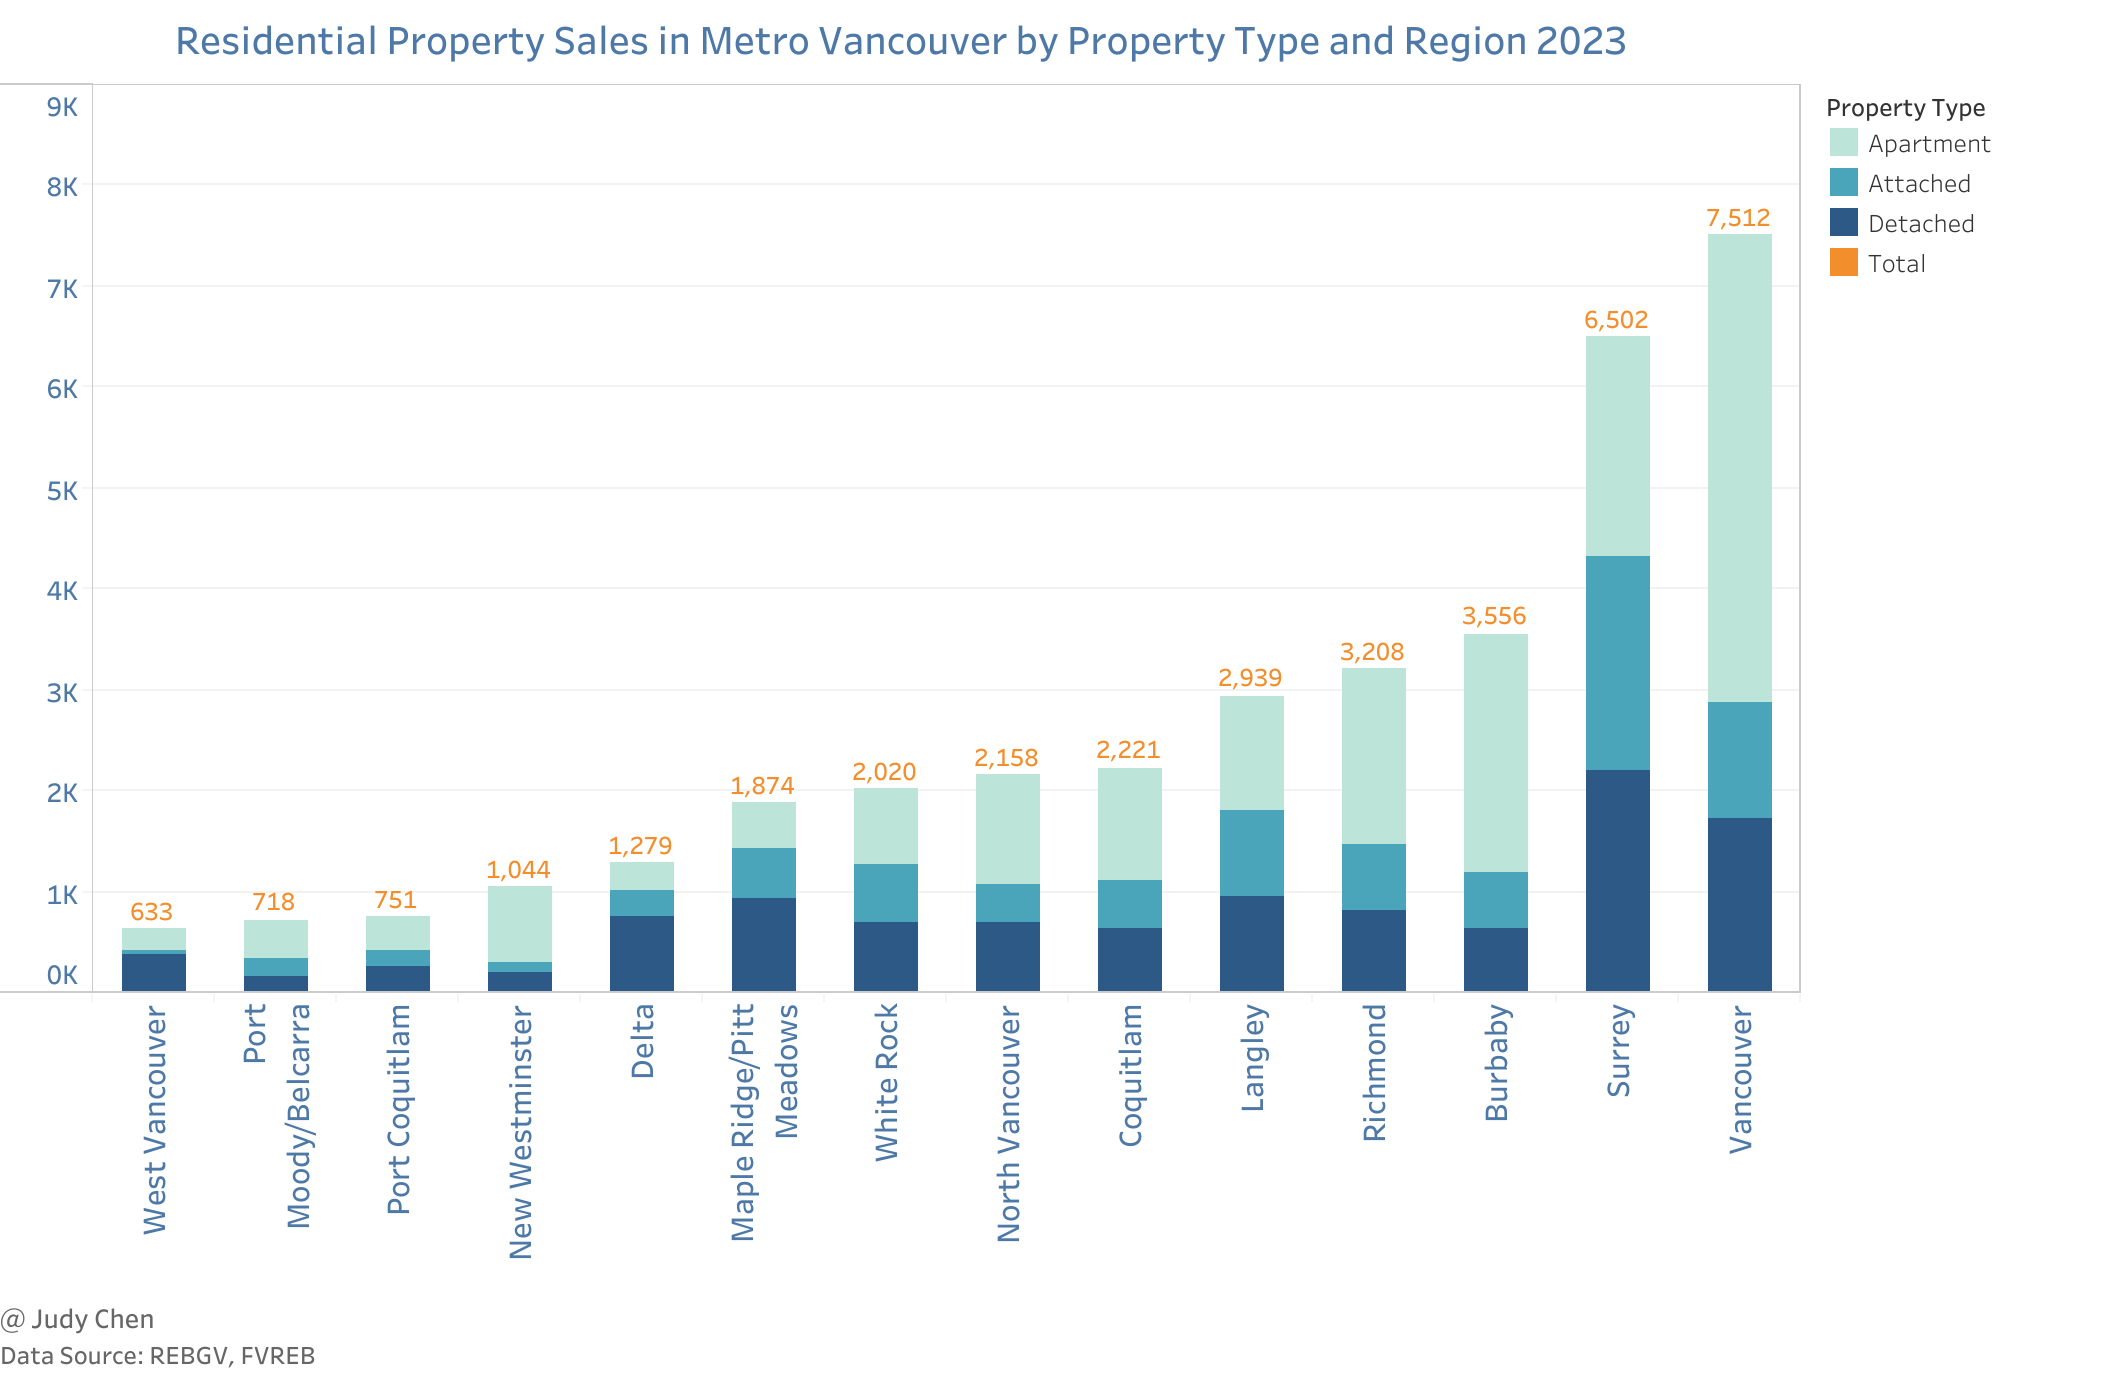
Nearly half (48%) of 2023 homes sales in Metro Vancouver were apartments, but this veried significantly across the region.
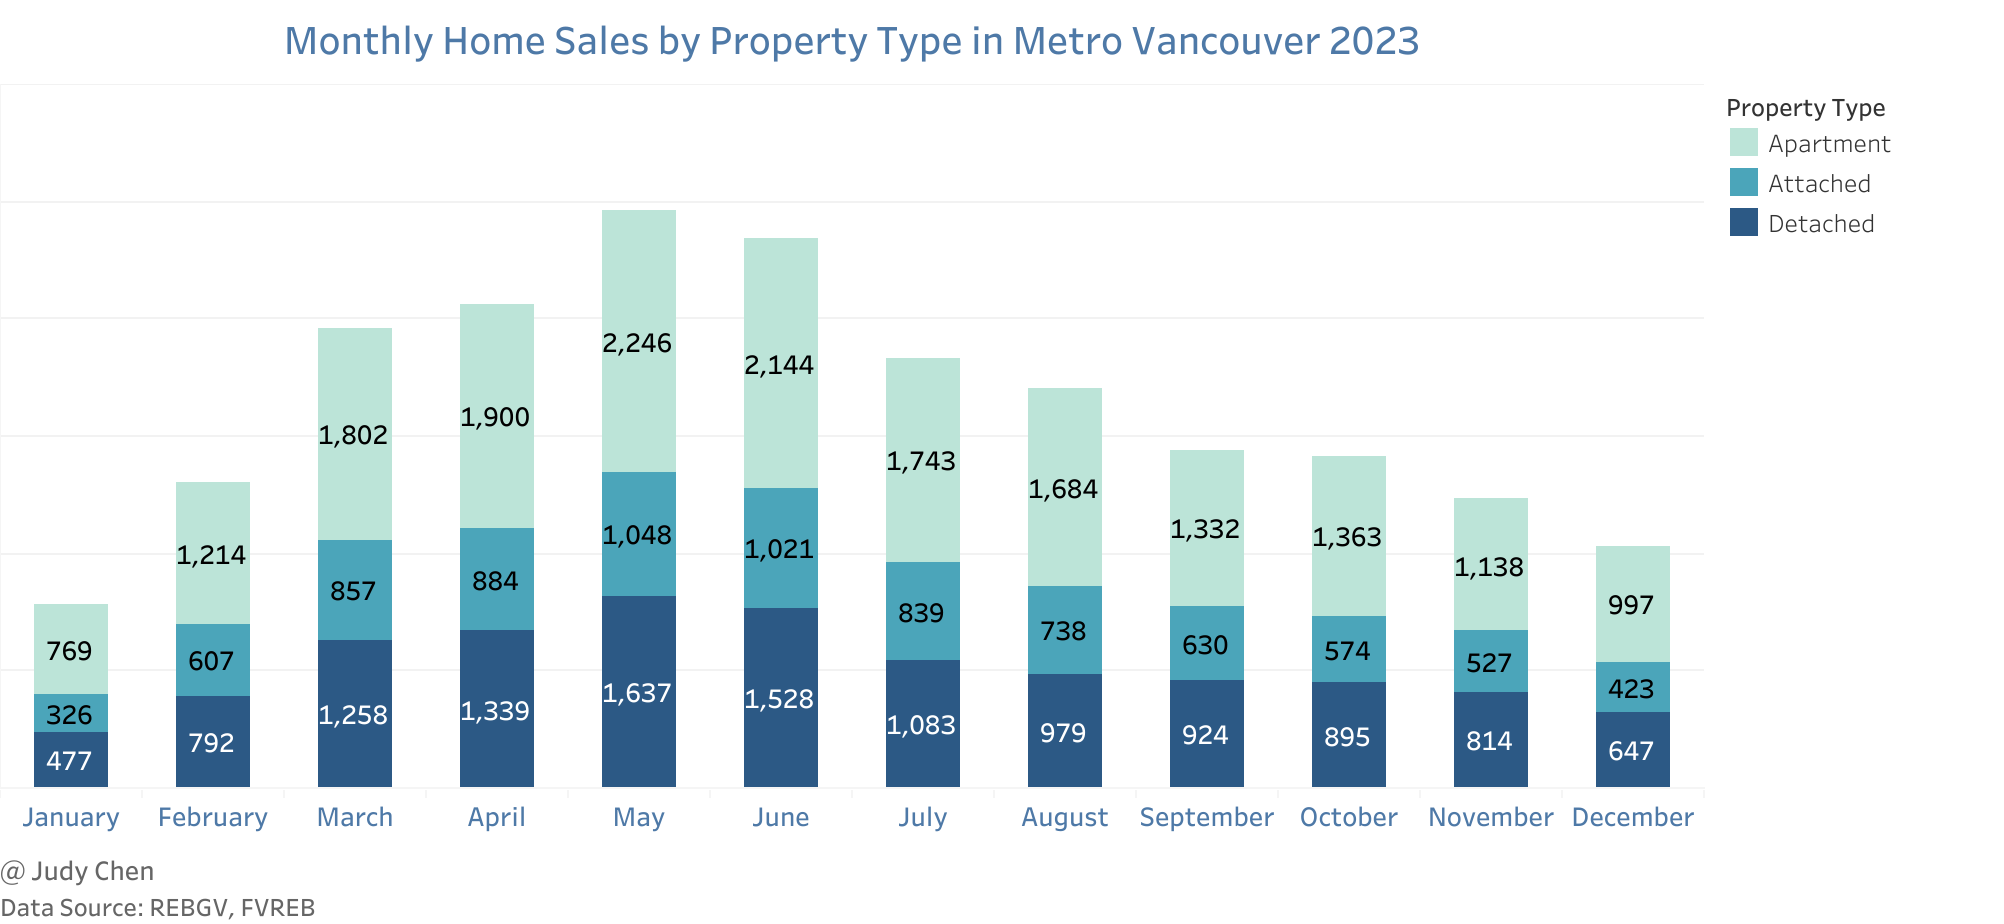
Sales in Metro Vancouver started at their lowest point in January, peaked in May, and then gradually declined throughout the year.
Vancouver, which saw the greatest number of sales in 2023, also had the greatest number of apartment sales (about 62% of its total sales).
Surrey boasted the highest numbers for detached and attached sales (34% and 33% of its total sales, respectively), maintaining a well-balanced distribution among residential property types.
New Westminster stood out with a remarkable 71% of total sales attributed to apartments, while Delta dominated in detached sales, accounting for 59% of its total transactions.
Benchmark Home Sale Prices#
Benchmark home sale prices in Metro Vancouver are key indicator of affordability in the housing market, and are provided by the MLS® Home Price Index (HPI).
Data is presented separately for the Real Estate Board areas of Greater Vancouver and the Fraser Valley recognizing the wide variation in sale price both by residential property type and by location.
Key Observations#
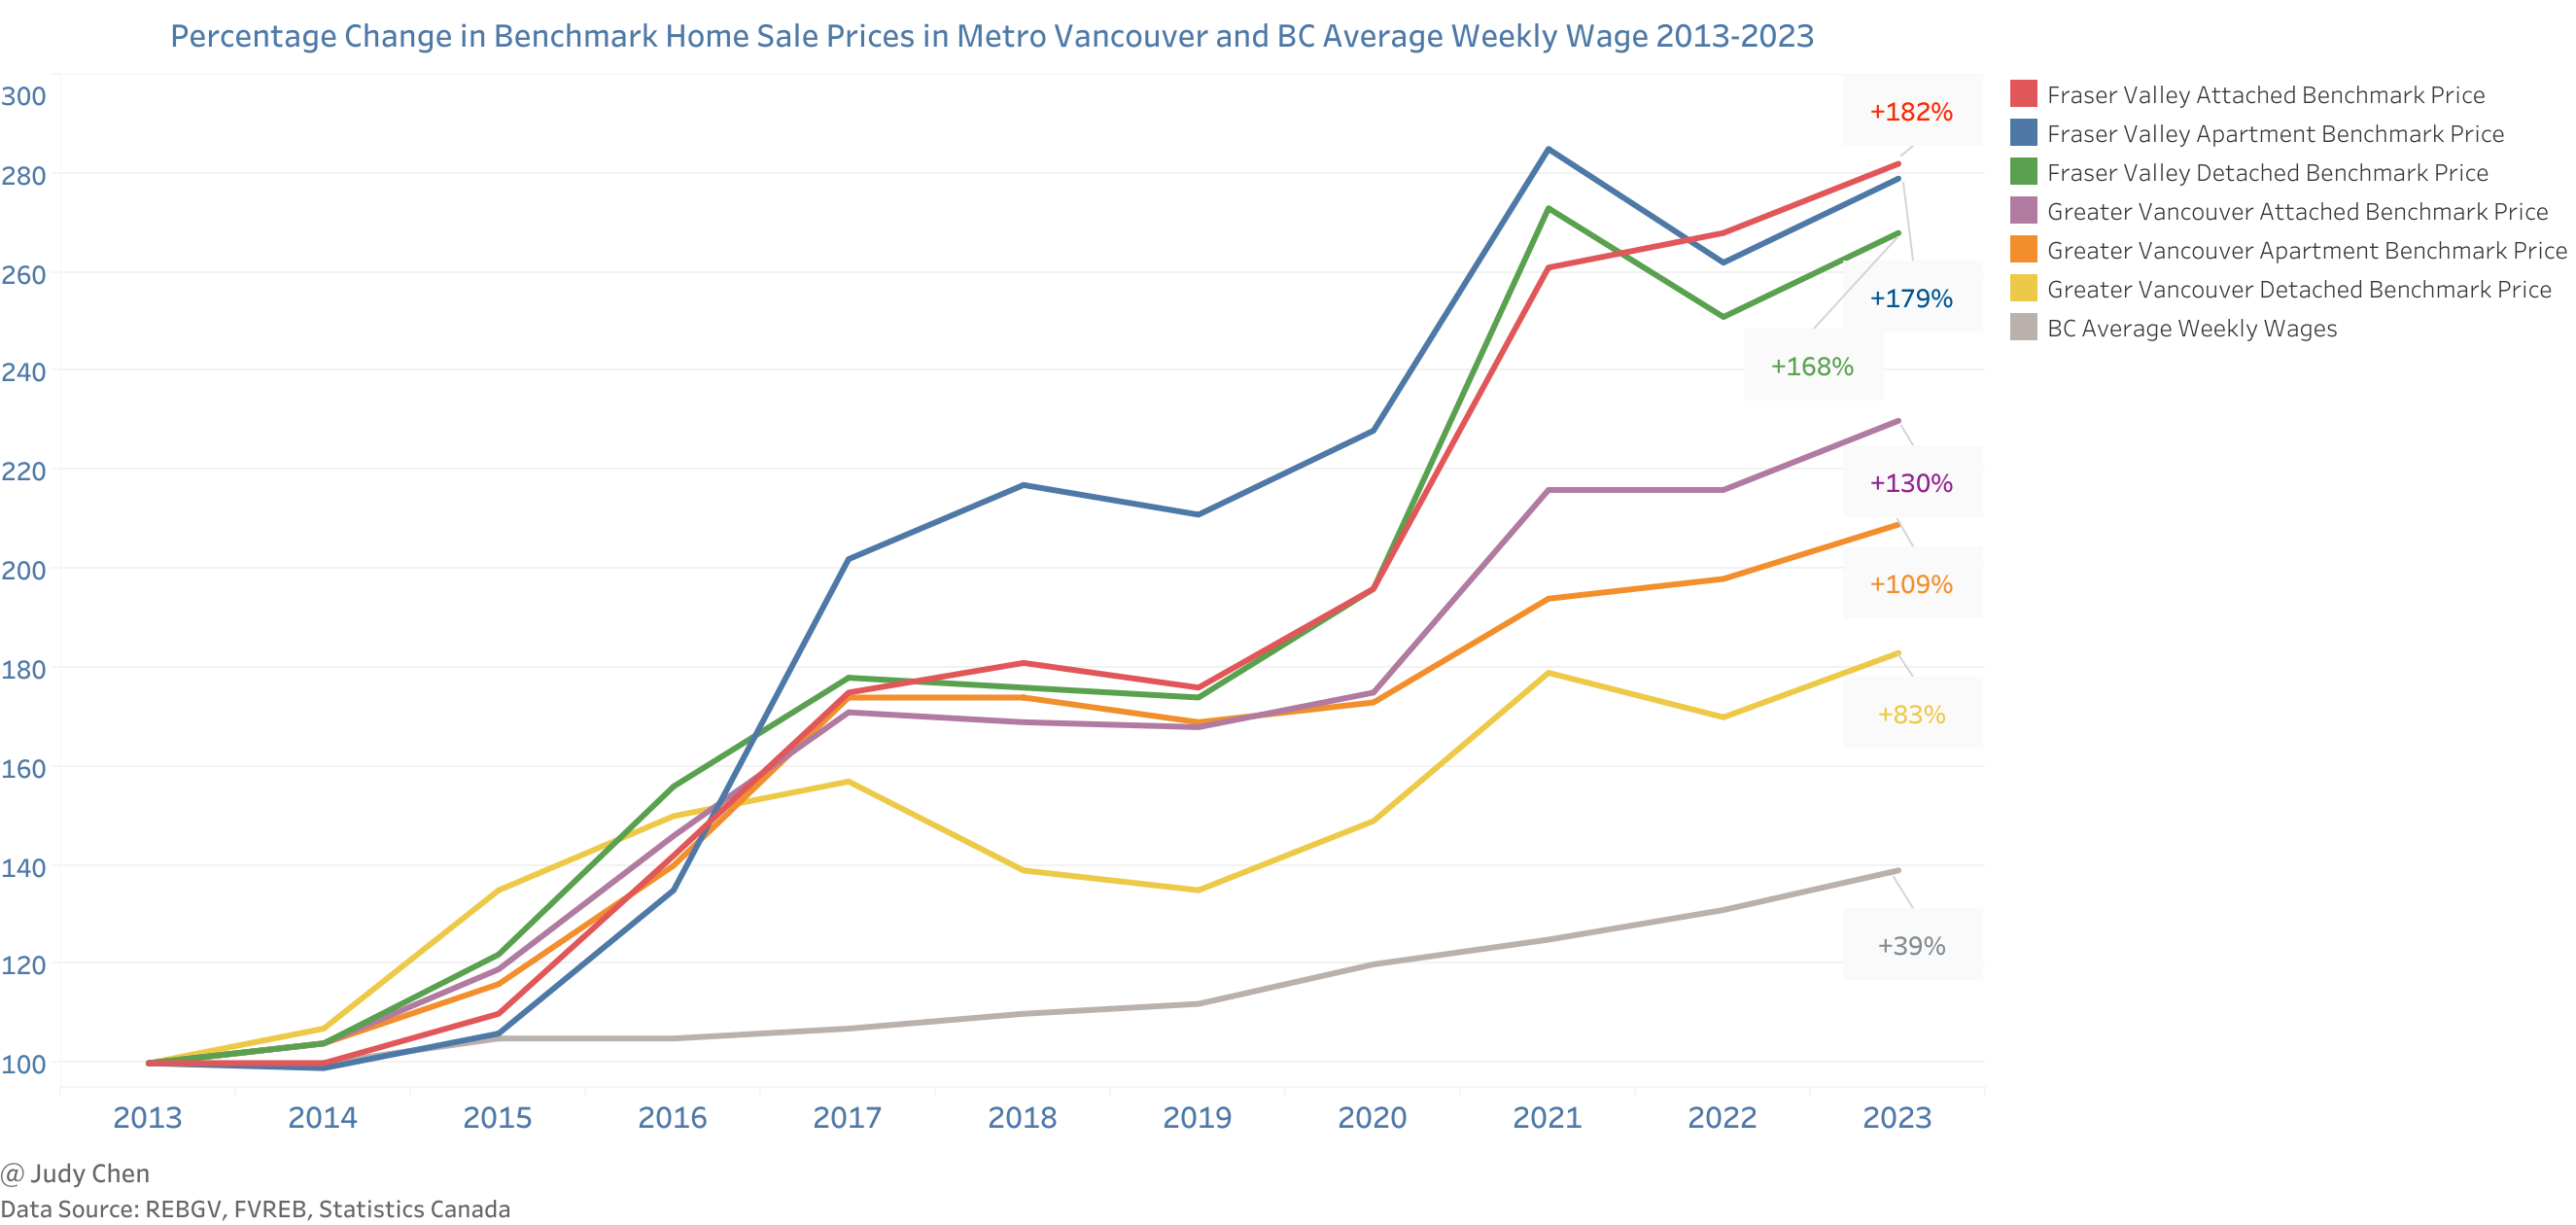
Benchmark prices doubled and nearly tripled over the past decade across Metro Vancouver, outpacing wage increases.
Attached benchmark prices exhibited the most growth, while detached prices increased the least in both Greater Vancouver and Fraser Valley in the past 10 years.
The REBGV-covered areas experienced slower percentage growth in benchmark prices compared to FVREB-covered areas over the past decade.
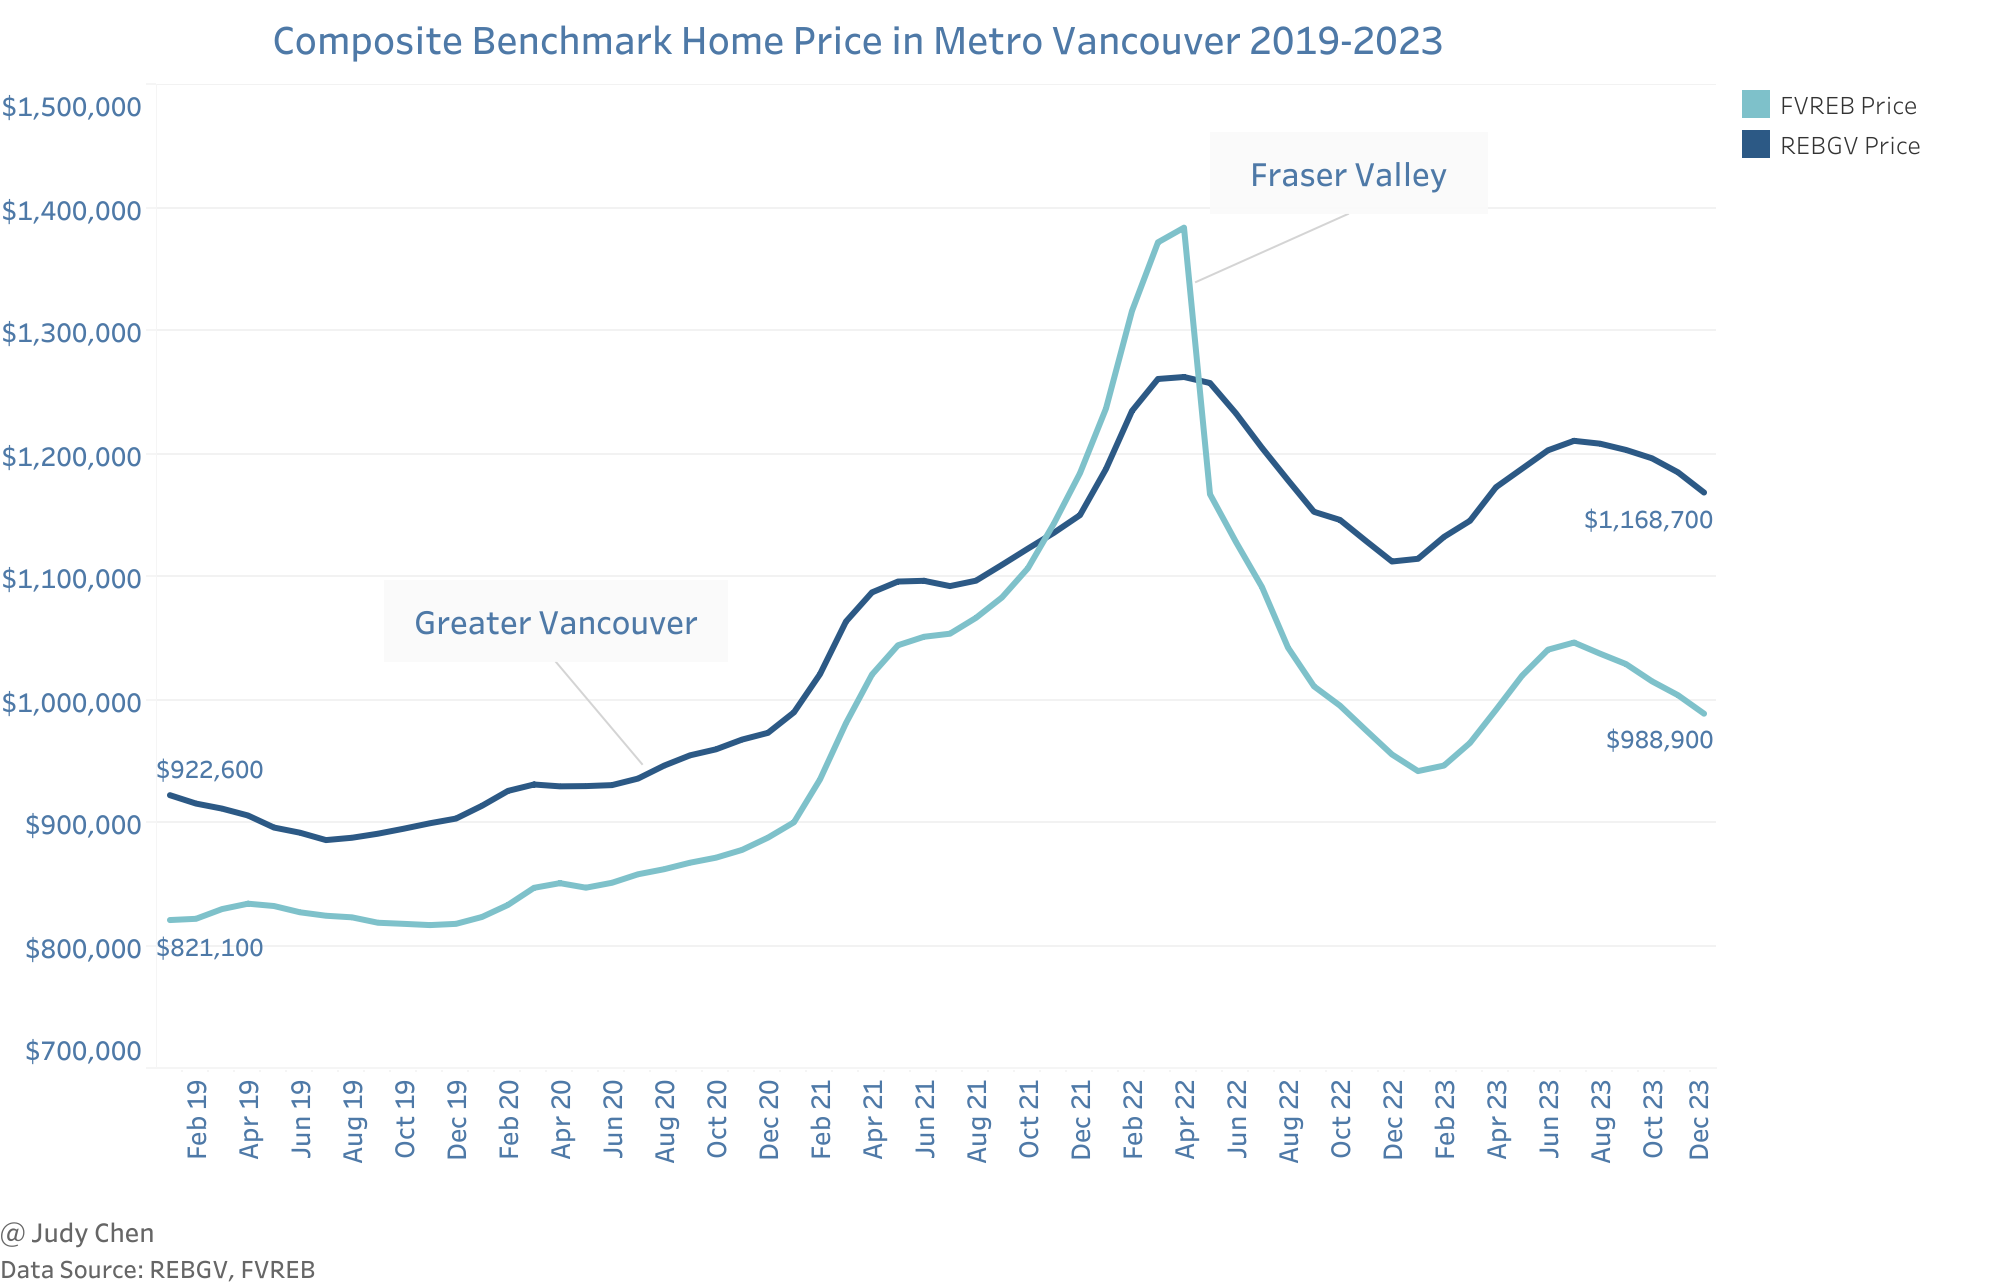
From 2019 to 2023, the composite benchmark price in REBGV areas outpaced FVREB in growth rate by 27% to 20%, respectively.
Composite benchmark price in FVREB areas consistently remained lower than those in REBGV areas for the majority of the time. However, there was a brief departure from this trend, occurring from November 2021 to April 2022, when the composite benchmark price in FVREB areas momentarily surpassed that of REBGV. Subsequently, it swiftly reverted to its original position, reinstating the prevailing pattern.
Composite benchmark prices in both Greater Vancouver and Fraser Valley rose from January to July in 2023, then gradually decreased towards the year’s end, finally with approximately a five percent gain throughout the year.
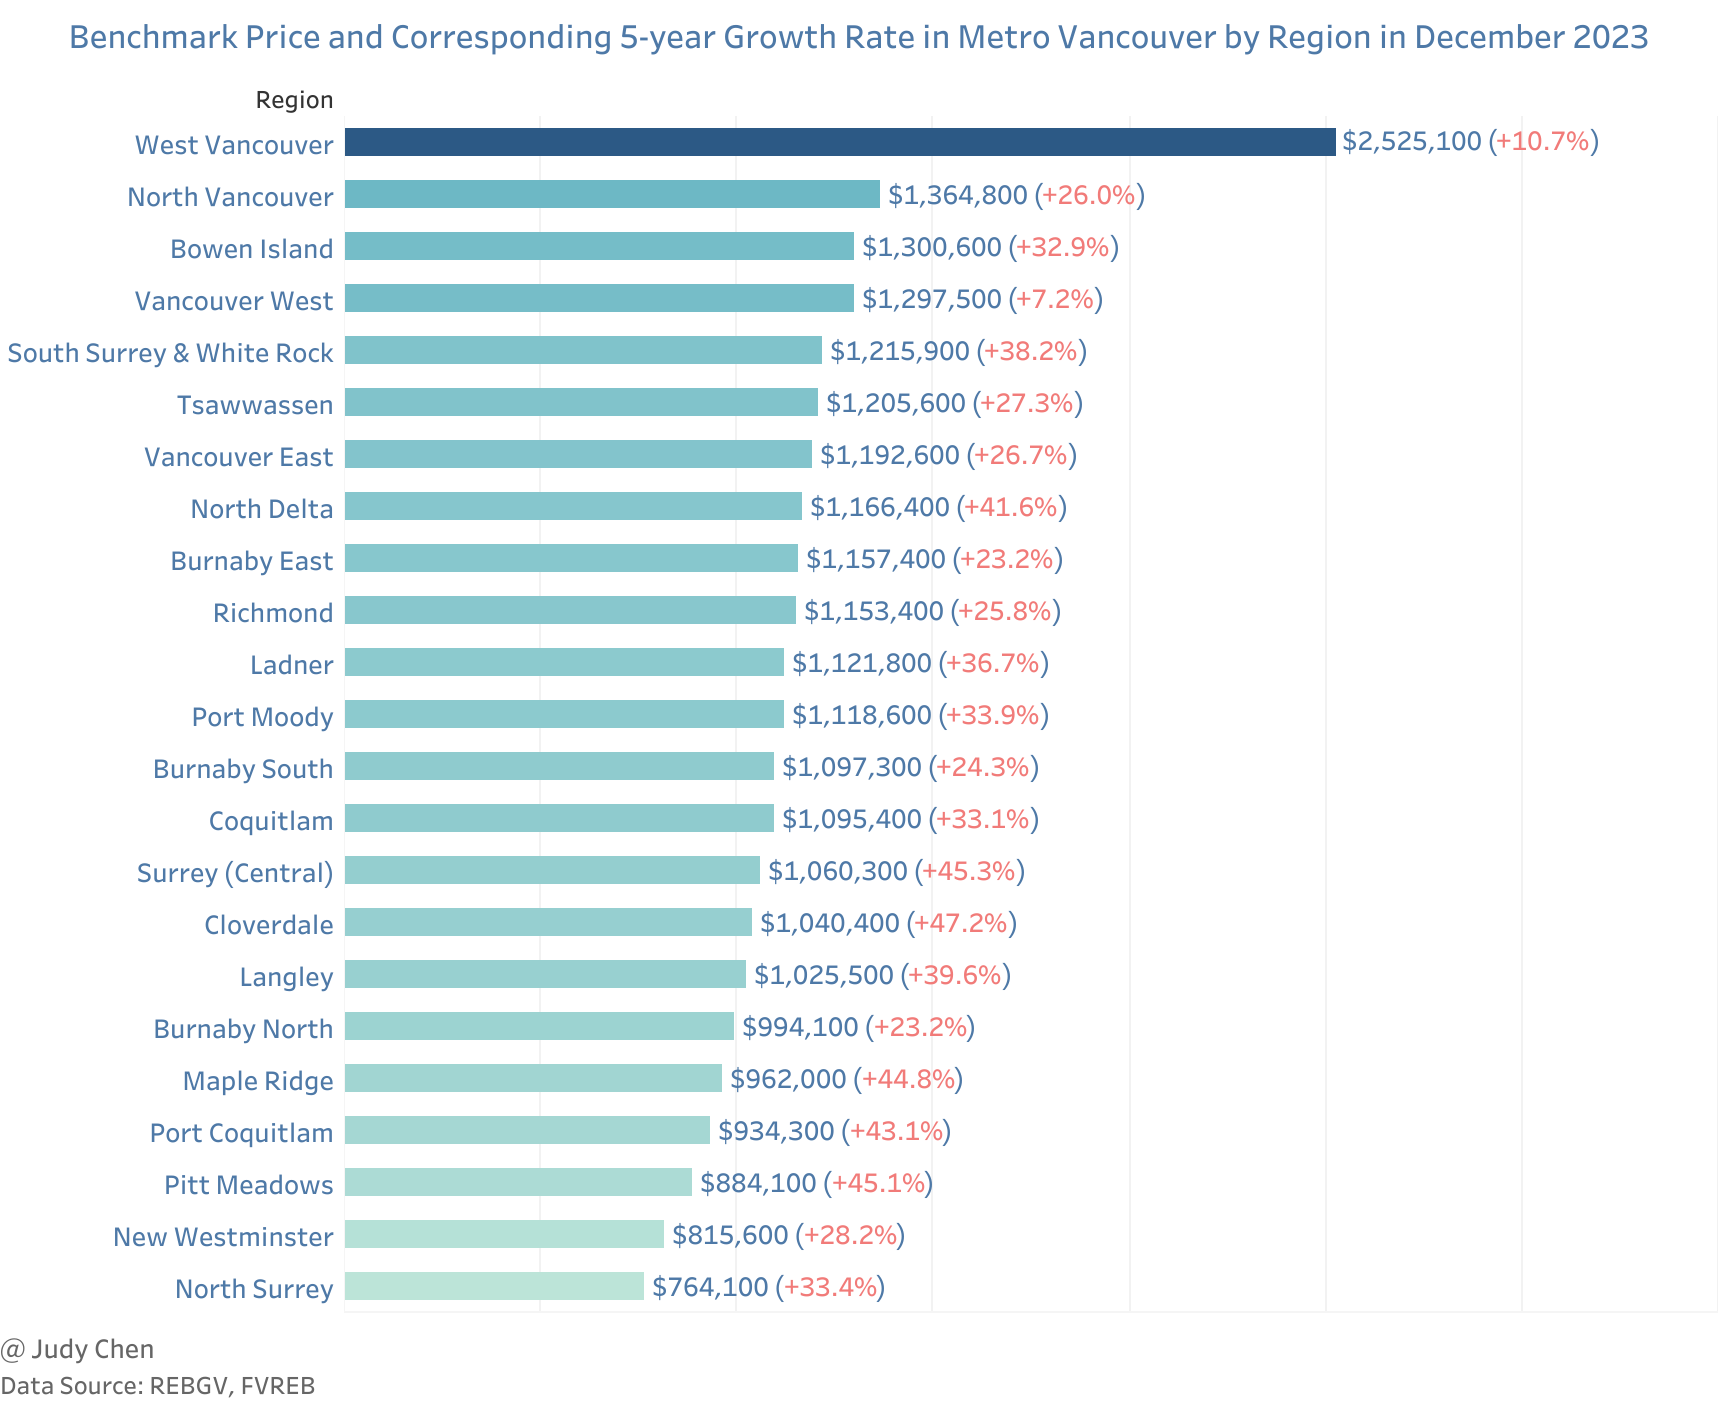
West Vancouver maintained its status as the most expensive area to purchase a home.
Cloverdale in Surrey experienced the highest growth rate at 47.2% in the past 5 years, while the west side of Vancouver had the lowest growth rate at 7.2%.
Sales-to-Active Listings Ratio#
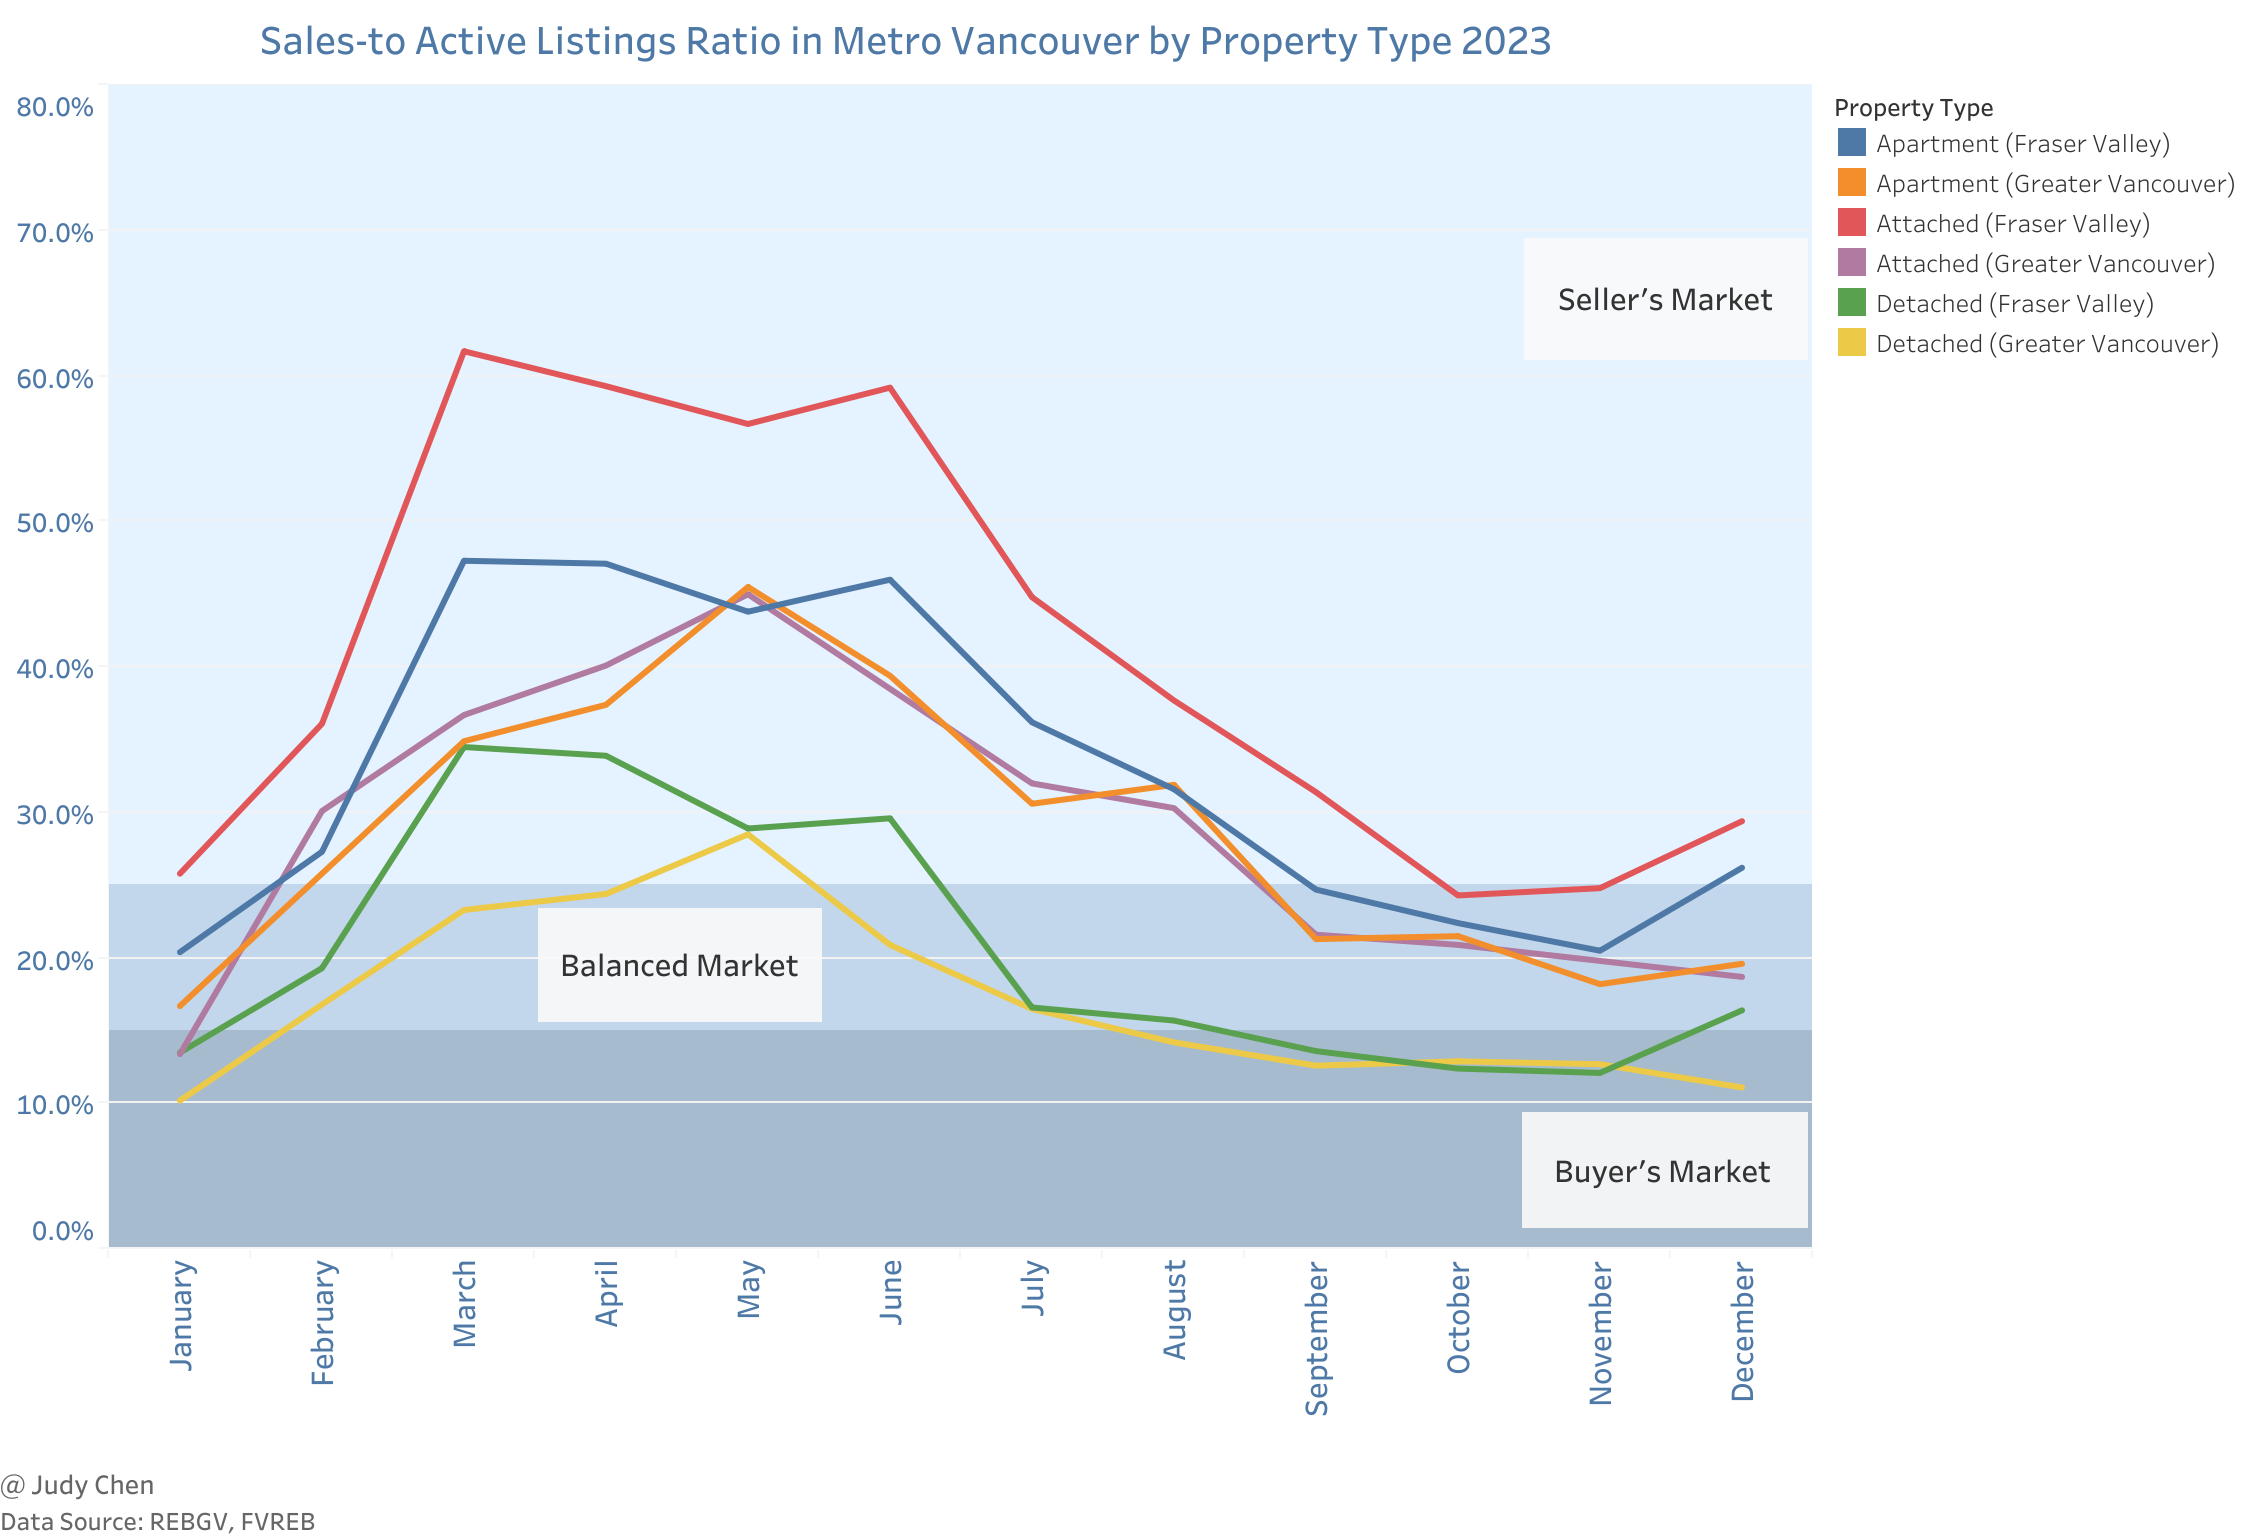
The Sales-to-Active Listings Ratio (SALR) measures the tightness of a market. According to BCREA, the housing market is considered balanced if the SALR is between roughly 15% and 25%. If the ratio is above this range, the market is in seller’s territory, and if it is below this range, it is in buyer’s territory.
Key Observations#
FVREB consistently reported higher SALRs than REBGV in most time for each residential property type.
In 2023, detached properties in REBGV areas spent half the year in buyer’s territory, while attached properties in FVREB areas predominantly favored sellers.
The apartment and attached markets entered seller’s territory in February but gradually balanced by September in 2023.
Conclusion#
Despite the challenges posed by high interest rates, Metro Vancouver’s housing market demonstrated resilience, closing the year with approximately a five percent gain in home prices across all segments. This resilience suggests that Vancouver remains an attractive destination, with elevated borrowing costs not deterring determined buyers.
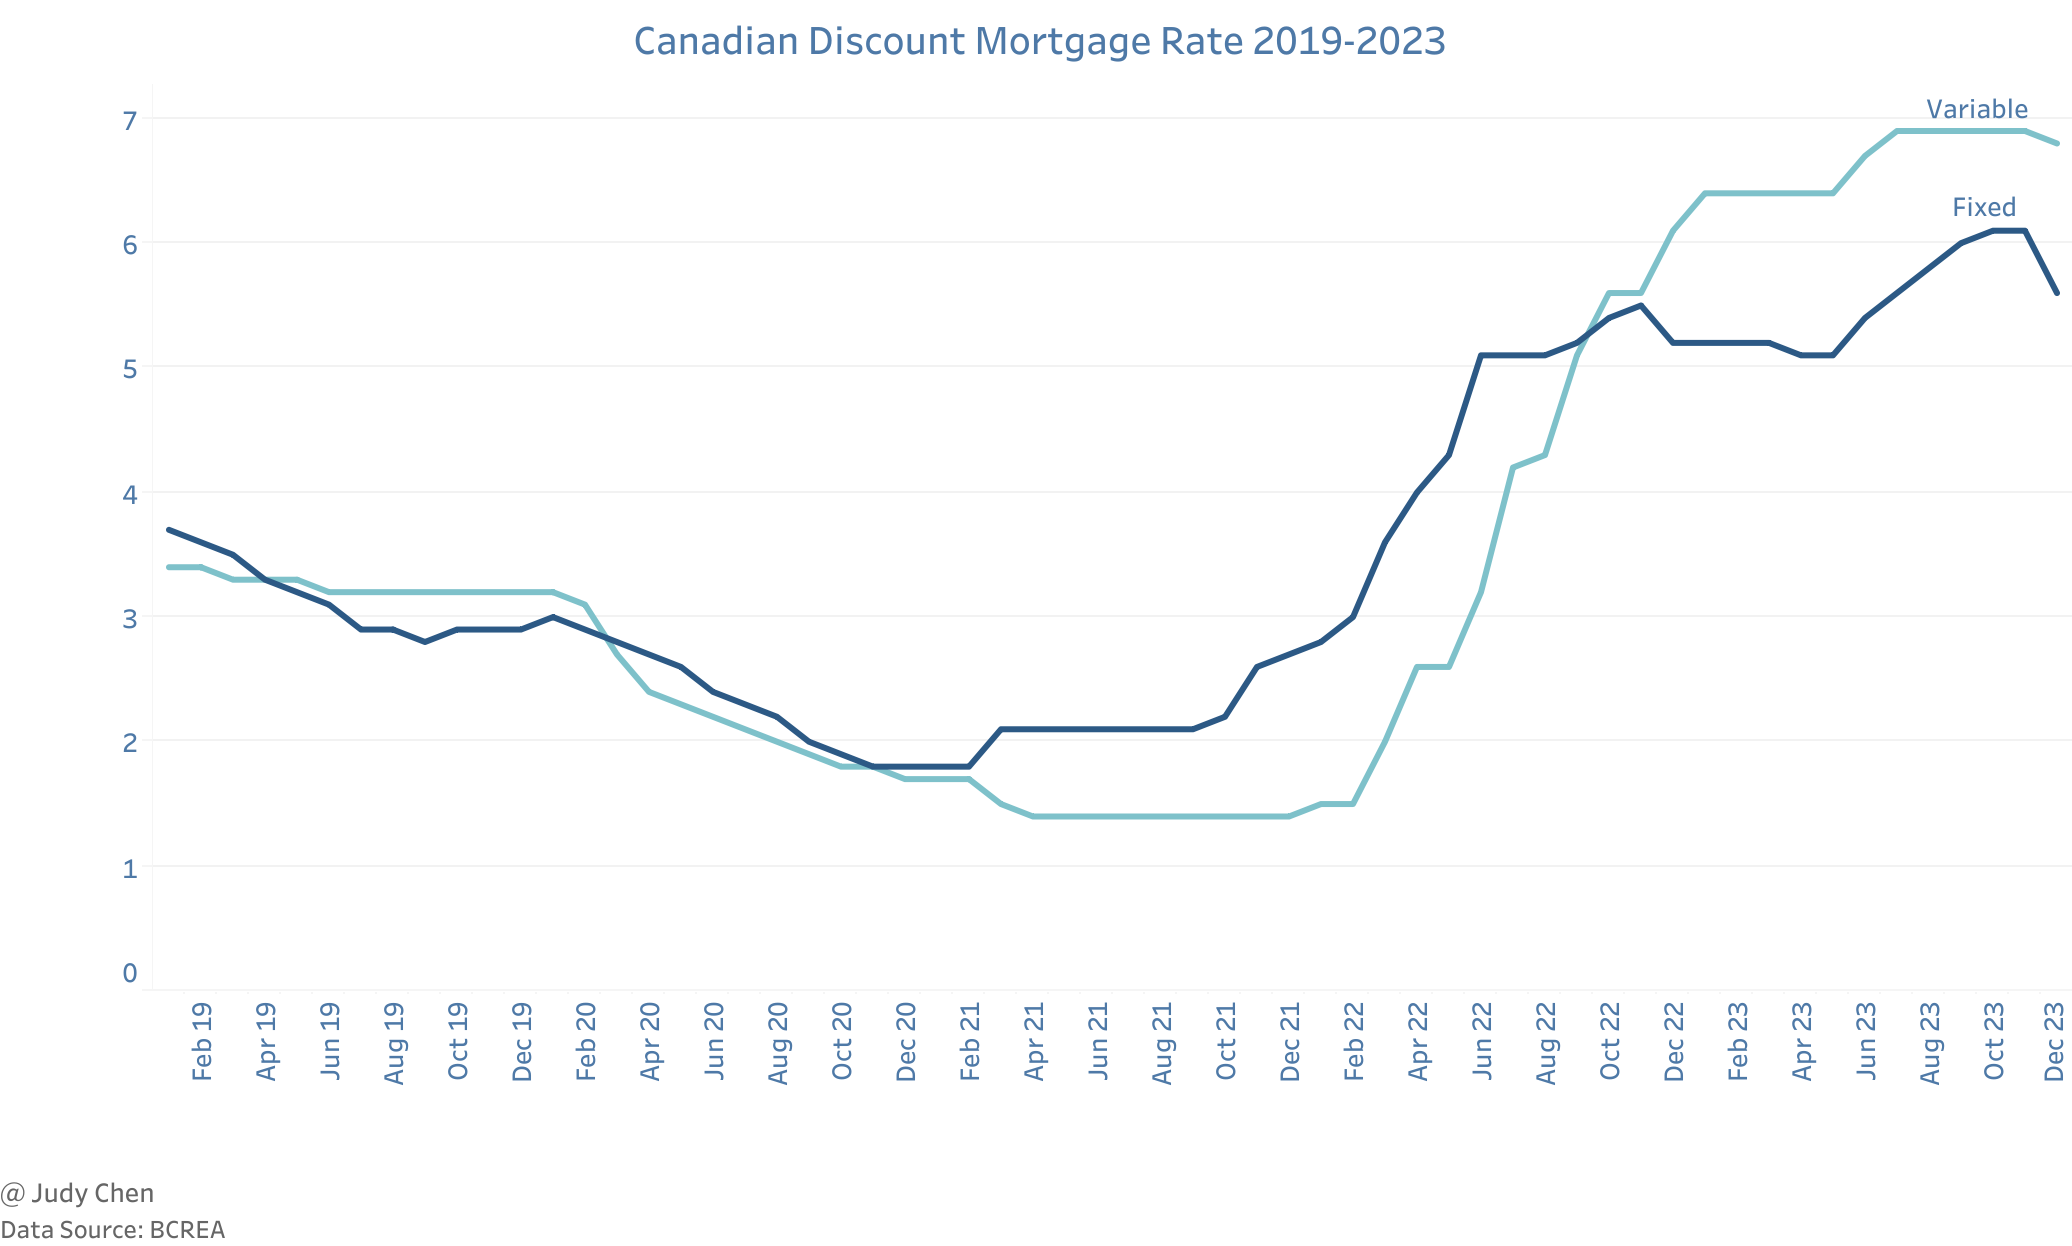
Looking ahead to 2024, increased optimism is anticipated as the Bank of Canada is expected to lower interest rates before mid-year.
Notes:
Areas covered by REBGV include: Bowen Island, Burnaby, Coquitlam, Maple Ridge, New Westminster, North Vancouver, Pitt Meadows, Port Coquitlam, Port Moody (including Belcarra), Richmond, South Delta (Ladner), Squamish, Sunshine Coast, Vancouver, West Vancouver, and Whistler.
Areas covered by FVREB include: Abbotsford, Mission, Langleys, Surrey, White Rock, Delta (excluding Ladner).
January 2024